Is It Time To Get A Battery?

I got my Electricity Bill the other day which set me wondering if I should invest in a battery for our house.

Our Situation

We live in a retirement unit which is reasonably compact.

As a result our 3.25 kW of Solar Panels takes up most of the available roof space.

The advantage of having a small house is that although we are all electric our daily usage is quite small.

The below graph shows our daily usage and solar export.

From the figures above it would appear that with a battery we should be able to store, and then use overnight 3kw of power almost every day..

Power Company Rates

Our current rates from Powershop are:

$0.2893/kWh Consumption Charge
$0.052/kWh Feed in Tariff

Annual Savings

The annual savings by installing a battery  will be:

Consumption Charge minus the feed in Feed In Tariff  multiplied by 3kWh multiplied by 365.

$(0.2893 – 0.052) x 3 x 365 = $259.84/year

NB There will be some efficiency loss in the battery but this may be compensated by the battery partially discharging and being recharged during summer days.

Conclusions

Recent industry figures (September 2023) indicate the installed cost of batteries is $1,000 to $1,300 per kW.h

This gives a cost for a 3kWh of $3,000 to $3,900,

Even with the cheapest battery the payback at $259/year is going to be over eleven year,.by which time the battery will have gone through over 4,000 charging cycles.

As I am not convinced that the battery will be in good condition after those 4,000 cycles I think I might not bother with a battery for a while yet.

If I see battery prices drop to around $500/kWh I might rethink..
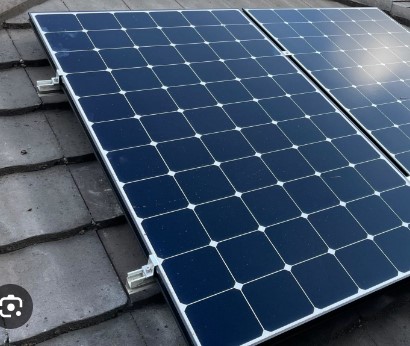


Solar Power – Reasons for Low Output

For each kw of installed capacity of solar panels on average you can expect to generate 3.5kwhrs per day.

This can however vary considerably for a variety of reasons.

Monthly Variation

On a peak summer day you may be able to generate 6 or 7kw hrs per day.

In winter it can be quite different. typical reasons include:

  • Shorter Days – The panels may only get around 6 hours of sunlight.
  • Weather – For most of us winter means more clouds and rain which reduce the sunlight.
  • Less than Optimum Angle With the sun low in the sky you won’t have the panel fully facing the sun unless you can change the angle.

Partial Shading

One of the things that most people don’t realise is that solar panels are ‘team players’.

The power that each panel in a string(circuit) generates is limited by the performance of the worst performing panel in the string.

This means that if one 200w panel in a string of 6 is shaded by as little as 10% the loss can be 120w.

That’s 10% of the total string 6 x the 20w of the single panel)

To minimise this problem you need to ensure:

  • All obstructions are minimised. Even a TV aerial, or toilet vent pipe can make a difference.
  • If you have panels on different areas ( for example on each on a different roof) they should be on different ‘strings’ with separate inverter inputs.

Dirt

Any dirt on the panels will reduce the effectiveness so a regular clean will help retain efficiency.

It’s also worth thinking about keeping birds from perching on the top edge and crapping on the panels. (You can get some plastic spikes to fasten to the panels)

Heat

Typically panels are at their highest efficiency at a panel temperature of 25degees C.

In the middle of summer the panel temperature can be 80 degrees.

If you panel is mounted to allow better air movement around the panel this will help keep the temperature down,  and help efficiency.


See Solar Electricity for more posts


Winter Sun

If you are going to get as much winter sun inside your house you want to minimise shading.

That could be from neighbour’s houses or even and boundary fences/hedges.

Here is how to check…………………..

Ideally you should be aiming for around 6 of hours of sunlight into your house on the shortest day (21st June).

To get the exact angle for your location you can get solar calculators on the net that will give you the suns angle for every hour of the day for any day of the year.

The diagram below shows the how to begin working out the effects of shade from a 1.8m fence to the North of a window


I have provided a TABLE that shows approximate midwinter shade angles ‘A’, and shade slopes ‘H/D’ for various positions of latitude.


Latitude Locations

Noon

9.00am -3.00pm

Slope H/D Angle Slope H/D
38 Melbourne 29.5 0.57 16 0.29


  1. The Bottom of the window is 0.15m above ground level
  2. The top of the fence ‘H’ is 1.65m above the bottom of the window(1.8m -0.15m)
  3. To make sure you get 6 hours winter sun in the window, divide the height of the fence above the bottom of the window by the ‘9.00am -3.00pm’ Slope (0.29).
  4. D = 1.65/0.29 = 5.7m. The fence needs to be 5.7m from the window for full sunlight for 6 hours.
  5. If the fence needs to be closer than 5.7m it worth checking if any sun gets to the bottom of the window. To check divide 1.65 by the ‘Noon’ Slope (0.57)
  6. D = 1.65/0.57 = 2.9m. If the fence is closer than 2.9m you may be better reducing the window size by raising the base.


This information also applies to Solar Panels for Heating and Power Generation

To provide summer shading see Shading Northern Windows


Curb Your Power

We are currently customers of Powershop, and have decided to get involved with an interesting program they are running.

The idea is that they will tell us by SMS when they are expecting very high demand.

If we can reduce our power use during the high demand period we will get a $10 credit to offset our power bill.

Here are some of the features

  • How often? . . . . . Between 2 and 10 times per year.
  • How Much Notice? . . . . . May be as long as 7 days notice but could be as little as an hour.
  • Time of power reduction . . . . .1 to 4 hours.
  • Amount of reduction? . . . . .For solar customers like us 0.05kW for each hour of the event . . . . For non solar houses 10% or 1 kWh.
  • How is it measured? . . . . . Your baseline is calculated from your smart meter readings.

The idea is that a program like this can reduce high demand blackouts.

Should be interesting and I will report back at the end of the summer.


The Value of West Facing Solar Panels

Its almost 2 years since I installed a solar power system on my current house.

The installation is 8 x 250 watt panels facing North and these 5 x 250 watt panels facing West.

Over the time they have been installed the amount generated has been:

  • North Facing panels – 5,164 kw
  • West Facing panels – 2,882 kw
  • Overall generation – 8,046 kw

Power production for each panel works out at:

  • 648 kw for North facing panels
  • 576 kw for west facing panels (89% of north facing panel’s production)

At first sight this seems to indicate that the North Panels are better value. . . . but there are a couple of reasons why this really isn’t the case.

  1. When we are using electricity
  2. Feed In Tariff (FIT)  at 11.8 cents/kw is less than the tariff for taking power from the grid of 25cents/kw.

Time of Use

Generally we are mainly out during the day so apart from some use in the morning (before the solar system is generating power) our main actual use is from late afternoon.

The main use during the day is just the refrigerators and an hour or so of washing machine use 3-4 times a week.

We are home most evening; running air conditioning/heating, cooking meals and watching TV

Effect of Tariffs

Most of the power generated by the north facing panels will be going into the grid and only getting us 11.8 cents. . . . say 30% saving power and 70% going to the grid at 25 cents/kw.

So for each North facing panel the value of the power  = 648 x 25 x 0.3 + 648 x 11.8 x 0.7 =  $102.1.

With the West facing panel power its going to be more power being saved than going to the grid  . . . . say 50% saving power and 50% going to the grid

So for each West facing panel the value of the power = 576 x 25 x 0.5 + 576 x 11.8 x 0.5  =  $106.0 . . . . .MORE THAN THE NORTH FACING PANELS!!!


Busting some Myths about Solar


I have been hearing a few discussions about Solar power where people are repeating myths. . . . . So here are four commonly heard myths and the truth.

MYTH

You must have a battery with a solar system

TRUTH

There is no requirement to have a battery. . . . If an solar salesperson tells you this he is trying to scam you and my advice is go elsewhere for your solar power system.


MYTH

Because of the low ‘Feed In Tariff’ you need a battery to make savings.

TRUTH

A battery cost a lot of money; so for the Tesla Powerwall you will be paying around  $12,000 to save 40-50 cents per day. . . . . . A lot of the savings with solar power come from using the power you generate. As far as the feed in tariff is concerned as the panels are relatively cheap you can make great savings. At the moment my $4,500 system, without a battery, is saving me $634/year (check this post:  Solar Power Update) almost 2 dollars a day.


MYTH

You need a large North facing roof.

TRUTH

These days panel prices have dropped so much that East and West facing panels can still be really effective. . . . .A further advantage is these panels generate much of their power in the morning and evening respectively which means you are more likely to be using the power rather than feeding the power into the grid. Over 35% of my panels face West.


MYTH

You won’t generate much power in winter.

TRUTH

Its surprising how much sun is around in winter that can help you generate power. . . . .For example in the five days before writing this post on 24th June 2018  my system generated over 30kwhrs of power


Will Your Roof Take Solar Panels?

Plenty of people are thinking about solar panels as they can save a lot of money.

But is your roof strong enough?

In the old days a house roof had a good factor of safety so they could take the additional weight of solar panels, or a solar hot water system easily.

These days it would seem some builders are cutting costs by using lighter trusses in the roof.

This means that the roof doesn’t have  the strength to take the weight of solar panels.

I have heard of new builders asking for $300, or more to upgrade the roof.

If you think you might want solar panels, and I suggest that it is a good idea, make sure you ask the builder if the roof is strong enough.

Don’t Get Fooled by the Inverter Rating

I have seen quite a few solar power advertisements that try to fool you!

They say something like:

    • 5kw Inverter

    • 16 x 260 watt Panels

    • Free Installation


You might think you are getting a  5kW System

The Truth

What you are getting is a 4.16KW system.

It is the panels that determine the maximum output . . . . . .16 x 0.26kW =  4.16kW

In fact this system would run more efficiently with a 4kW inverter than the advertised model as inverters are at their most efficient close to their advertised rating.

My own system has 3.3kw of Panels with a 3kW Inverter, and very rarely generates the full 3.0kW, and then only for a few minutes.

The experts say that the best combination is when the rating of the panels exceeds the inverter rating by around one third.

This post    Lower Output Reasons   explains why the output from the panels may be lower than you might think.

Solar For Free?

But Is It Worth It?


I recently came across a scheme by AGL called the ‘Solar Smart Plan’

The Plan

You sign a 7 year contract.

AGL install panels on your roof for free.

You are able to buy the power generated by the panels during the day for a reduced rate (I understand this will be 12c/kwhr)

Savings Comparison

A few weeks ago I posted about the performance of my solar system at this link:   ‘Solar Power Revisited’

Basically I bought a 3.3kw system for $4,450 which on current usage should save me $550 dollars per year.

Based on our usage the ‘Solar Smart System would generate the following benefits:

Annual Grid Power Costs Saving = 824 kwhr x  $0.15  = $123.30

Annual income from Feed In Tariff  = $0

Total Annual Benefit  = $123.30

Meanwhile they receive 1,389 kwhrs they can then sell to others for over 27cents/kwhr  = $375 (plus the power they sell back to you of $123.30)

Conclusion

All the above is based on rates for my supplier (Powershop) , , , , if AGL rates are higher the outcome may be worse.

As I wouldn’t have paid anything there is a benefit . . . . however I would be signing away the rights to my roof for $123 a year.

It’s also not clear what happens at the end of the 7 year contract.


I think I am a lot happier paying the upfront cost and getting more than 4 times the saving.

Solar Power Revisited – We Are Carbon Positive

At the start of this year I decided to install solar panels on my roof.

I posted about how I arrived at the decision HERE

Now I have around 6 months data, and the Feed In Rate (FIR) has increased I thought I would check on how well the investment is going.

Power Use

Currently we use electricity for lighting, space heating, cooling, some cooking and general domestic use.

Between our 3.3kw of panels being switched on in late January and the 15th July the following data has been recorded.

  • Power generated by panels:   1,801 kwhrs
  • Power fed into grid:  1,389 kwhrs
  • Power from grid:  1,158 kwhrs

As you can see I have actually put 231 kw hrs more into the grid than I have taken out.

In a full year I should be putting around 460kw hrs more into the grid than I take out, so we are now ‘Carbon Positive’ in relation to electricity use.

Cost Benefit

To calculate typical ongoing annual savings I have based all rates on the latest rates from our supplier Powershop (From 1st July)

  • Grid Power cost   $0.271
  • Feed In Tariff   $0.118

Annual Grid Power Costs Saving = (1,801 – 1,389) x 2 x $0.271  = $223.30

Annual income from FIT = 1,389 x 2 x 0.118 = $327.80

Total Annual Benefit  = $223 + $327 = $550

Annual Return on our $4,450 system = 12%     (Around 4 times better than we could get at the bank)

Edit

After a years operation I find that the actual amount generated has been 4,310kwhrs an additional 509kwhrs over my original estimated annual output.

As we were overseas for the three months of winter I don’t have a realistic figure for what a typical usage would be so I am assuming that the all the additional power would go to Feed in Tariff (FIT)

This would make the revised calculations:

Annual Grid Power Costs Saving = (1,801 – 1,389) x 2 x $0.271  = $223.30

Annual income from FIT = 3486 x 0.118 = $411.34

Total Annual Benefit  = $223 + $411 = $634

Annual Return on our $4,450 system = 14%     (More than 4 times better than we could get at the bank)


Exit mobile version