I have previously talked about Bushfire reserve supplies. . . . But how much?
I see various minimum water volumes put forward for bush fire reserves. For example in early 2014 the following applied.
Victoria, regulations for new builds require 10,000Litres.
South Australia the country fire service suggests 22,000Litres.
Just because there is a minimum requirement that doesn’t mean that is going to be enough water to deal with an incident for your property. Here are some thoughts on what I feel is appropriate.
10,000litres which can only be accessed via a fitting that meets the requirement of your local fire fighting service. This varies from state to state so check with your local brigade. This supply is really a last ditch supply available to the fire brigade when they are activly defending your property from direct attack.
2 – 4,000litres to assist you in dealing with ember attack with a hand held hose, in advance of the fire front reaching the property, and following the passing of the fire front.
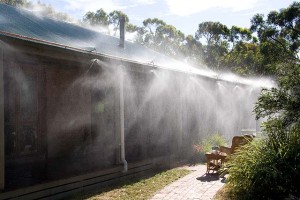
Adequate Volume to run a sprinkler system from starting the system until the fire front has passed. This volume will depend on the number of sprinklers, and the time you intend to run them. In other words Flow and Time:
Flow For a small house you could be using around 2,400litres per hour (Say 2 impulse sprinklers on the roof and 6 spray nozzles on the side of the house under attack) For larger Houses or those with several outbuildings the volume will be much larger.
Time The time will vary depending on your Fire Plan.
If you are planning to stay and defend your property you will want enough volume to defend your property during severe ember attack, while the fire front passes through your property, and to damp down afterwards. (Say 2 hours, 5,000litres)
If your Fire Plan is to set all the sprinklers running and leave early on days of high fire danger you will probably need to allow 12 hours running time per day of fire danger.(Say 28,000litres per day)
The above figures are indicative and any spray system should be properly designed.
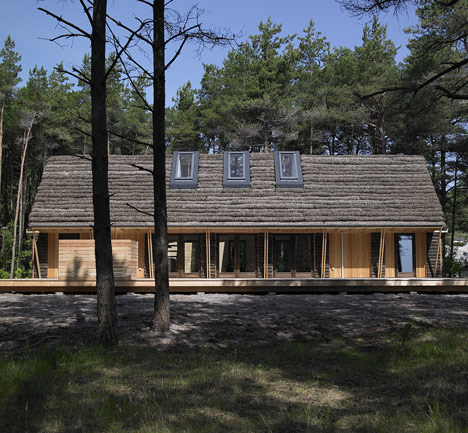
If you read up about energy efficiency you will come across the expression ‘Thermal Mass’ . . . . . . but what is it? . . . . . and how does it work?
Materials with Thermal Mass
The most common materials with Thermal Mass in new houses are; Concrete, Stone, Slate, Tiles and Brick. In some cases water tanks can also be used to provide Thermal Mass. (But not easy to use as evaporation can reduce the effectiveness, and the resultant humidity can cause damp)
A key characteristic of these materials are they are dense(heavy) and have the ability to absorb excess heat and then release it in cooler periods.
Thermal Mass need to be exposed. Covering with carpets or timber floors insulates them and prevent it from being as effective.
Heating
The trick is to put either ‘Free or Low Cost Heat’ or ‘Spare Heat’ directly into the thermal mass which is released to keep your house warm longer.
Free or Low Cost Heat
Direct winter sunlight on a floor or a wall is a great source of free heat. Just make sure you have Properly Designed Shade to keep the summer sun out.
Sources of low cost heat are things like using off-peak power, or excess solar power. This can provide either direct heating, or run heat pumps circulating hot water into a slab.
Spare Heat
Each time a wood heater is filled with wood it should initially be run with the vents fully open to minimise build up of creosote and soot in the flue . Without a thermally massive surround to help absorb the excess heat you can quickly over heat your room.
Any exposed thermal mass that is not heated may feel cool to the touch as it will be no warmer than the room temperature. However as the room cools this thermal mass will still release its heat back into the air to slow down the rate the room cools down. (This is known as ‘Thermal Lag’).
I frequently see comments like “Ceiling insulation is next to worthless in summer.”
I have even heard people say “With a hot roof space it will be overwhelmed.” and “After the sun has gone off it stops the house cooling down.”
Here is the truth:
All insulation works by slowing the rate of heat transfer. If the roof space is hot some heat will pass through to the room below. The insulation will slow the rate that the room heats up from the roof space.
Ceiling insulation isn’t enough to keep the room cool by itself. The room will still get hotter if heat is leaking in through poorly insulated walls and windows.
Ceiling insulation, by slowing the heat gain from the roof space, will reduce the cost of mechanical cooling.
In a well insulated conventional ceiling minimal residual heat remains in the plasterboard and ceiling insulation. The heat in the room is just hot air. The best way to remove the hot air is to open the windows when the air temperature outside is less than inside, or run the air conditioning.
When most people think about rainfall they think about the amount of rainfall . . . . . . . . . but it’s just as important to understand how hard it can rain, the ‘Rainfall Intensity’.
The ‘Rainfall Intensity’ is important when thinking about things like; Roof Gutters, Down Pipes, Stormwater Pipes , Tank Overflows, and even how high your house is above ground level.
Photo courtesy of www.mirror.co.uk
Recurrence Interval
When talking about heavy rainfall you will frequently hear talk on the news about things like a ‘1 in a 100 year storm’. What that means is that a statistical calculation indicates that a storm of that strength is only expected to occur once in any 100 year period, the ‘Recurrence Interval’.
There are two rainfall intensities that the building codes normally consider. They are based on the peak 5 minutes during a storm for vaious ‘Recurrence Intervals’.
Intervals can be from: 1 in 20 years to: 1 in 100 years (See this link for more information: Roof Choices)
Intensity Calculation
Statistical intensities have been calculated for all locations in Australia and are available at the Bureau of Meteorology (BOM) Website.
Search for ‘Intensity Frequency Duration (IFD)’
To Use the IFD
Enter “your town name ” “coordinates” into Google and write down the coordinates
Click on the Create An IFD button
Enter the coordinates into the Decimal Coordinate box
Enter the town name in the Location Name box
Tick that you accept the Conditions of Use
Press the Submit button
Click on the Table tab
The following is the top line of the table for Werribee in Victoria.
Duration
1EY
1 year
50%
2 years
20%
5 years
10%
10 years
5%
20 years
2%
50 years
1%
100 years
5 mins
44.9
60.1
83.4
99.7
121
153
179
The units are mm of rain in 5 mins (Multiply by 12 to get an hourly flow rate)
Low Rainfall Intensity
Parts of the Plumbing and Building Codes refer to areas of “Low Rainfall Intensity”.
A location of “Low Rainfall Intensity” means the 5 minute rainfall intensity for an average recurrence interval of 20 years is not more than 125 mm/hour.
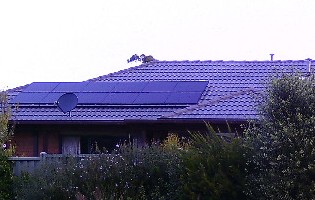
Downsizing to a smaller new house for your retirement? Don’t forget to think about solar power.
Last week I revised a post ‘Solar Power is it Worth It?‘ but if you are approaching retirement, like me, there can be an even bigger financial advantage in having solar installed.
Differing Lifestyle
Because we are both out at work during the weeks I calculated that with a 1.5kw system costing around $3,000 panels we will save:
Weekdays $1.09
Weekends $1.40
See the original post to see how I arrived at these figures
After retirement its likely that our weekday usage patterns will be more like the weekends so our annual savings are expected to be 365 x $1.40 = $511.
Effect on Pension
I am assuming that you will have some money from superannuation, but not enough to mean you won’t be eligible for a state pension.
If you have more assets then the Government limits your pension. It will be reduced by $39 per annum for every extra thousand dollars. (Basically the government takes the interest)
Invest $3,000 in a solar power system and that becomes part of your house, which is excluded from the governments asset test. You will therefore be eligible for an extra $117 a year pension.
Summary
The expected benefit for your $3,000 investment is:
$511 + $117 = $628.
20.9% Return with a Payback of Under 5 years
I don’t know about you but i’m hoping to live a lot longer than 5 years beyond retirement!
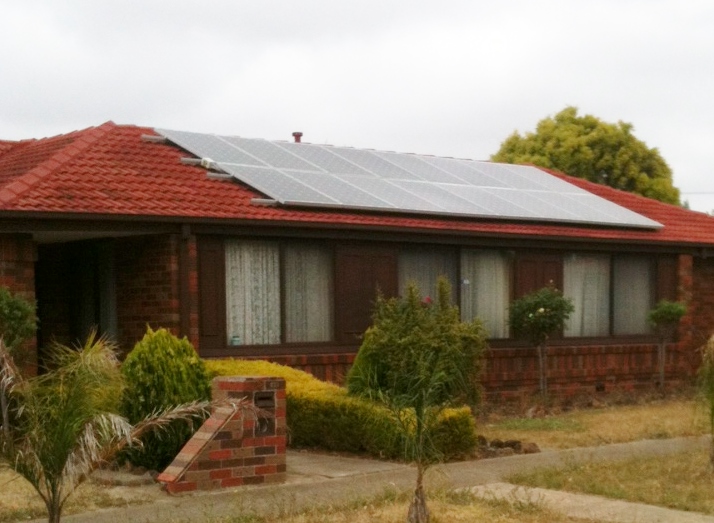
There is a lot of marketing information around about Grid Connected Solar Panels but not many independant facts. Here’s an example of an evaluation of a basic system for a house.
We use around 16kw hours (kwhr) of electricity per day which is fairly typical;
For each 1kw of solar panels we can expect to generate around 1300kw hours per year that’s an average around 3.5 kw hours per day;
For a basic 1.5kw system we should generate on average about 5.2kwhrs;
Our current tariff for power is $0.3152 /kwhr regardless of time of day;
I have done the evaluation assuming that any surplus power is sold back at$0.08/kwhour.
How Much Will Be Saved?
Weekdays (as we both work and the house is empty during the day) we should be able to put at least 2.5 kwhrs into the grid and use a maximum of 2.7kwhrs running fridges etc)
Income 2.5kwhr @ $0.08 = $0.24
Saving 2.7kwhr @ $0.3152 = $0.85
Benefit = ($0.24 + $0.85) x 260 days = $283
Weekends we probably will only put 1kwhr into the grid as we may well be at home using power for TVs, heating or cooling, etc.
Income 1kwhr @ $0.08 = $0.08
Saving 4.2kwhr @ $0.3152= $1.32
Benefit = ($0.08 + $1.32) x 104 days = $145
Total annual benefit is $428.4
Is it worth it?
Well there are some 1.5kw systems being advertised now with various rebates which cost less than $3000.
If you had $3000 on term deposit returning 4% that’s $120 a year, which would then be taxed. Alternatively if you put the cost on your mortgage that will mean that you are borrowing $3000 at a rate of around 6%. That’s costing around $180.
From these figures it looks like for the basic system you will be around $250-$310/year better off.
NB. I first did a Cost Review in 2011. Since then the cost of panels, and the government subsidies, have gone down. The cost of power from the grid has gone up. The overall financial advantage is around the same.
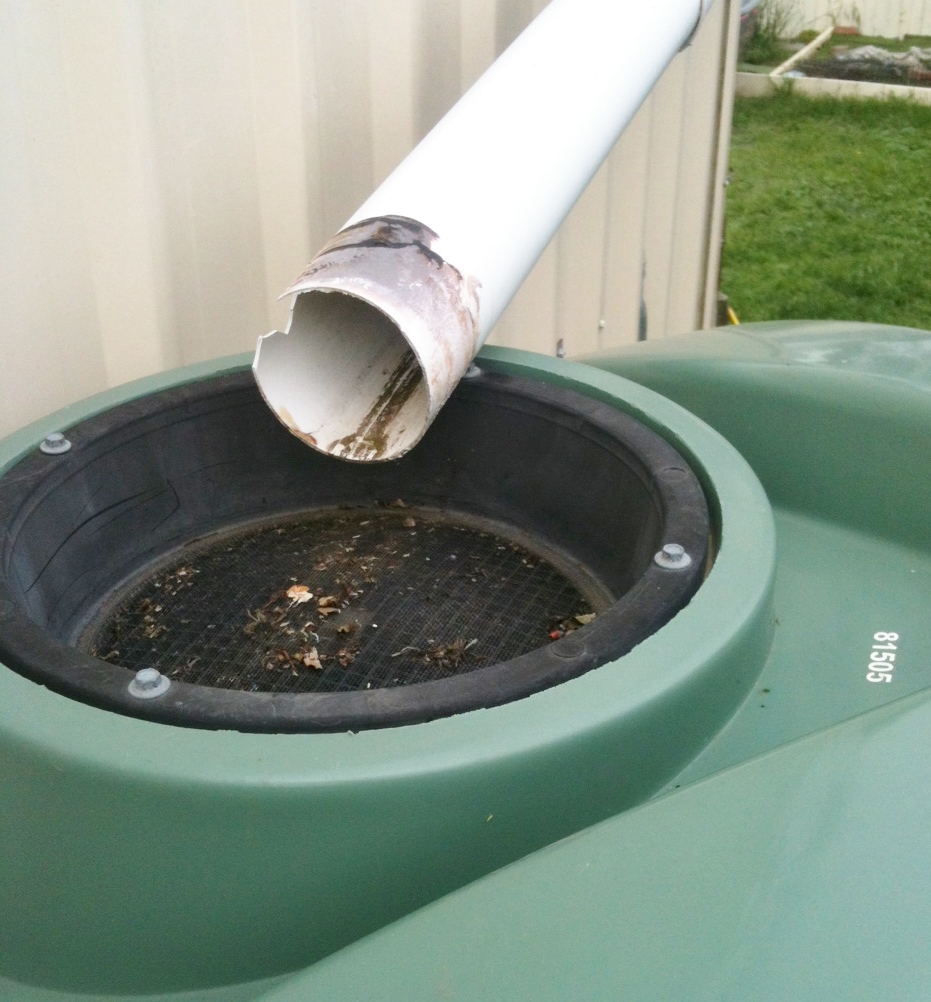
This is a fairly typical rainwater collection installation.
Gutters discharging to a pipe which discharges onto a screen fitted to the tank access point, cheap and cheerful!
I must have seen it hundreds of times . . . . . . but it has some negative implications on the water quality you will get from the tank!
Problems
Although the screen keeps leaves, mozzies, and other debris out of the tank it lets sunlight in. This will encourage algae growth inside the tank.
At the top of the tank the screen is out of view and consequently hardly ever gets cleaned. As a consequence the leaves rot and organic materials gets washed into the tank providing nutrients for that algae.
Discharging water into the top of the tank isn’t the best location (see this link: Inlet Improvements).
Solutions
Install a cover over the access point (Something like a round dustbin lid with a hole for the inlet pipe) This will keep the light out, but the issue of the rotting leaves will remain.
Screen the leaves out at the gutter discharge using a rainwater diverter with a self cleaning screen (for an example see this link: Supadiverta), and pipe the inlet flow to the bottom of the tank.
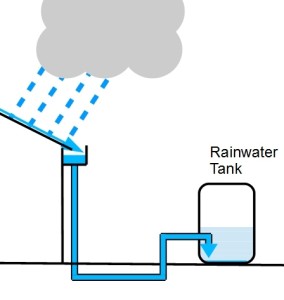
This diagram indicates a charged rainwater collection system. These are sometimes called either a “wet” or a “pressure” system.
NB. This diagram has been simplified for clarity. A leaf diverter, and an adequate overflow, must also be fitted.
With this type of system a section of the pipework always remains full.
As the pipes are under pressure it is essential all the joints in above ground and underground pipework are fully watertight.
ADVANTAGES
Allows you to discharge water at a height above the ground level at the down pipe (But not at the top of the tank – see the post: Inlet Improvements)
Neater than above ground pipework
Additional down pipes can be connected without diverting pipes along walls.
DISADVANTAGES
It is more likely to block as the flow through the pipes can be fairly slow and the low points can collect silt. (It is also more difficult to unblock.)
Higher cost than above ground systems due to trench excavation, and additional inspection fittings.
Potential for mosquito breeding in water unless appropriate screes are installed.
Harvesting additional downpipes without adequate overflow capacity can result in the tank overtopping during heavy rain.
I have previously carried out a worked example of the insulation of a Brick Veneer Wall, so as a comparison here is double brick wall.
I have also shown (in brackets) the effect of using a hebel block in place of one of the brick ‘leaves’:
Element
R value
Outside surface air layer
0.03
110mm brick
0.08
25mm cavity
0.12
110mm brick (*or 125mm Hebel Block)
0.08 (*0.81)
Plasterboard 10mm
0.08
Inside surface air layer
0.12
Total R value
0.51(*1.24)
U value = 1/R
1.96 (*0.81)
The heat losses or gains for 150 sq m (fairly typical external wall area) of this type of double brick wall at 15 degrees above, or below, outside temperature will be:
Area x ‘U’ x temperature difference = watts per hour
150m2 x 1.96 x 15degrees = 4410watts per hour
Heating/Cooling Requirement = 4.41kw/hour
Using Hebel for one of the leaves will improve the heat loss as follows:
150m2 x 0.81 x15degrees = 1822watts per hour
Heating/Cooling Requirement = 1.82kw/hour
Still not as good as the 1.17 kw/hour of the typical brick veneer construction
Don’t forget heat is also lost through windows, ceilings floors and ventilation.